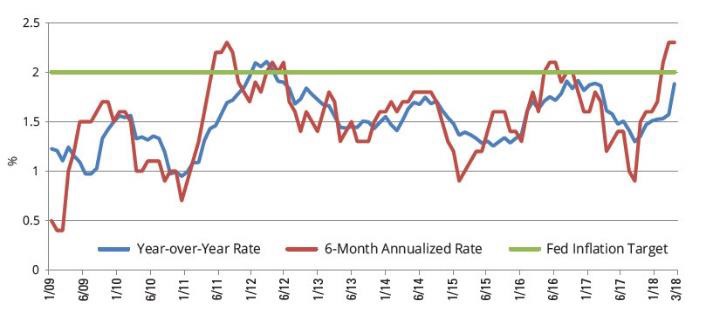
The erosion of purchasing power through price increases is referred to as “inflation” (though it has a more detailed technical definition). A prosperous economy needs some inflation to sustain growth but excessive inflation can stall growth and derail a conservative portfolio. This year, we begin paying more attention to the inflation rate as it appears to tick above the Federal Reserve’s target rate (“green line”).
Inflation is a negative and important part of evaluating portfolio performance but, in the last years, we’ve been lulled into ignoring it (since it stayed below the Federal target rate). To help understand inflation’s impact on purchasing power, consider the following illustration of the effects of inflation over time.

Source for 1916 and 1966: Historical Statistics of the United States, Colonial Times to 1970/US Department of Commerce. Source for 2017: US Department of Labor, Bureau of Labor Statistics, Economic Statistics, Consumer Price Index—US City Average Price Data.
In 1916, nine cents would buy a quart of milk. Fifty years later, nine cents would only buy a small glass of milk. And in 2017, nine cents would only buy about seven tablespoons of milk. How do we protect your portfolio against this loss of purchasing power throughout our lives and particularly in retirement?
Investing and saving today for future spending
As purchasing power declines over time, investing in fixed income (bonds and annuities), in terms of inflation, increases the risk of outliving your assets. This is particularly exacerbated by fear of market volatility and the practice of increasing fixed income and reducing equity as we age. Although we agree that fixed income allocation is useful to reduce volatility we are not in agreement with tools such as Target Date funds which automatically increase fixed income based solely on age.
Investors know that over the long-haul stocks (equities) have historically outpaced inflation, but you may not know that there have been stretches where this has not been the case. For example, during the 17-year period from 1966–1982, the return of the S&P 500 Index was 6.8% before inflation, but after adjusting for inflation it was 0%. Additionally, if we look at the period from 2000–2009, the so-called “lost decade,” the return of the S&P 500 Index dropped from -0.9% before inflation to -3.4% after inflation. These are a reminder that S&P 500 equity return alone is not always able to protect purchasing power.
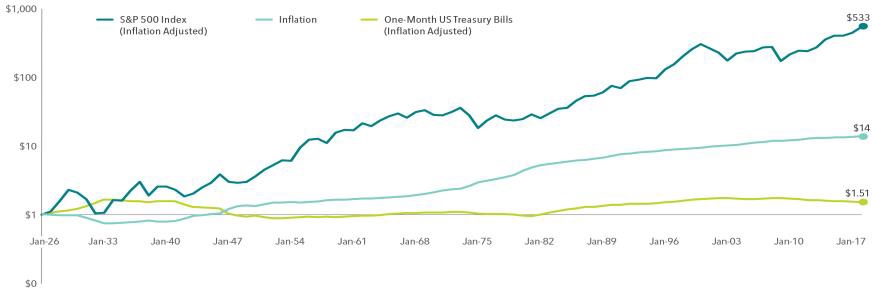
Despite these tough periods, one dollar invested in the S&P 500 in 1926, after accounting for inflation, would have grown to more than $500 at the end of 2017 and would have significantly outpaced inflation. On the other hand, the story for US Treasury bills (T-bills), however, is quite different. T-bills are often used as a proxy for a safe fixed income allocation. From 1926 to 2017, T-bills were unable to keep pace with inflation, and an investor would have experienced an erosion of purchasing power. As you can see in the chart below, one dollar invested in T-bills in 1926 grew to only $1.51 at the end of 2017. Yet a purchase for $1 in 1926 would cost you $14 in 2017! [caveat: other bonds/fixed income did better than T-bills.]
Growth of $1 from 1926–2017

S&P and Dow Jones data © 2018 Dow Jones Indices LLC, a division of S&P Global. All rights reserved. Past performance is no guarantee of future results. Actual returns may be lower. Inflation is measured as changes in the US Consumer Price Index.
Your portfolio with AIKAPA has a fixed income component to protect against loses based on short-term unexpected equity downturn. Instead of increasing the fixed income component of a portfolio with age or as fear of loss grows, we prefer to educate clients on how the portfolio works to both create and protect wealth. We do not encourage reduction in equity exposure based solely on increased age. Even so, we evaluate individual allocation, risk of outliving assets, and risk tolerance annually and encourage clients to let us know if they are anxious about their quarterly portfolio returns. Our target is to provide enough equity for growth/inflation with just enough fixed income to protect and not create anxiety over portfolio changes.
We think that experience with a diversified global portfolio needs to start well before retirement. Combining this experience with ongoing education and open communication we believe is the best way to determine fixed income allocation.
Edi Alvarez, CFP®
BS, BEd, MS

