
The AIKAPA equity portfolio is a global portfolio intended to provide diversification of US capitalization with uncorrelated assets over the rest of the world as well as within the US. We evaluate and reset the Global allocation based on both risk and known capitalization for countries throughout the world annually and review it quarterly.
I thought you might find educational an overview of country specific public equity capitalization that we use each year to set the AIKAPA equity strategy. Capitalization is the available wealth from the business marketplace in each country – we measure the ability to generate income/wealth for the investor. World financial market capitalization size is not the same as the world’s landmass, population, gross domestic product, or even exports. We often divide World equity into Developed (at $72T or 88%) and Emerging ($10T or 12%) country public capitalization.
To gain perspective it is useful to understand that there are about 3,500 public companies in the US consisting of 61% of the World’s total market capital (this was about $50T at end of 2023) and yet ONE company (Apple) holds $3T of those assets which is about 4% of the World’s capital. This one large company holds more market capital than Canada or France and about the same as the entire UK!
| December 2023 World Equity Partial List by Decreasing % Capital by Country * USA (3,481 companies) – 61% of World Capital ($50T) * Japan (2,557 companies) – 6% of World Capital ($4.7T) * UK (590 companies) – 4% of World Capital ($2.9T) * China (2,295 companies) – 3% of World Capital ($2.4T) * Canada (525 companies) – 3% of World Capital ($2.2T) * France (229 companies) – 3% of World Capital ($2.1T) * India (1,535 companies) – 2% of World Capital ($1.8T) * Switzerland (172 companies) – 2% of World Capital ($1.7T) * Germany (248 companies) – 2% of World Capital ($1.5T) * Australia (486 companies) – 2% of World Capital ($1.5T) * Taiwan (1,458 companies) – 2% of World Capital ($1.6T) (The data above is an excerpt from the 2023-Dimensional funds annual report and only includes a small number of countries for illustration purposes). |
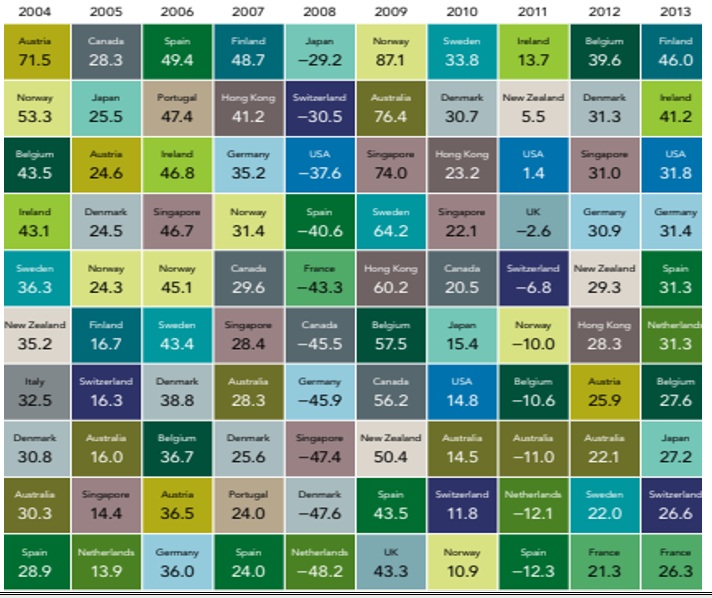
But Can We Select Which Countries Provide the Best Returns? Most people assume that the US is the best market performing country every year since it has the largest capital. The facts show that the US doesn’t always even make the top ten best performing developed countries. That said, the last 6 years have been unusual, from 2018-2023 the US has performed in the top 10 countries, in five out of six years (83%)! A major accomplishment. BUT it is a different story in the prior ten years. If we look earlier, from 2004-2013 (see chart below), we find that for 6 of those years the US was altogether missing from the top 10 performing countries. It only made the top 10 best performing countries 40% of the time.
If you look over the chart of the best performing developed countries below, you’ll also see that we can’t predict which country will do best in any year but by exposing the portfolio to other countries based on a combination of country capitalization and level of country risk we can improve the overall AIKAPA portfolio long-term performance. The largest impact is from increasing the probability of including exposure to countries that experience better performance when the USA under performs (uncorrelated countries). Looking for uncorrelated assets is an important way that a diversified portfolio generates higher long-term performance over other strategies.
Developed Market Countries Ordered by Equity Returns Each Year (2004-2013)
Edi Alvarez, CFP®
BS, BEd, MS